
Poisson and xG: a quick setup for a football prediction model

Poisson and xG have become standard tools for serious football bettors who want more than gut feeling and team gossip. When you combine expected goals data with a simple Poisson model, you get a fast, transparent way to price goal markets and 1X2 odds. Many mobile sportsbooks and tools, including apps promoted via phrases like Betwinner APK télécharger gratuit, push live stats and xG feeds directly to your phone – but the real edge comes when you know how to turn those numbers into probabilities yourself.
What are xG and the Poisson Model in Football Betting?
Before building anything, you need a clear picture of what xG and Poisson actually do for football prediction.
Key concepts in a quick snapshot
Here is a compact comparison of the two concepts and how they fit together for betting:
|
Concept |
What it Measures |
Typical Use in Betting Markets |
|
xG (expected goals) |
Quality of chances created/allowed (per shot or per match) |
Rating attack/defence, power rankings, live match evaluation |
|
Poisson model |
Probability of different goal counts, given an average rate |
Pricing correct score, O/U goals, BTTS, derivative markets |
|
Team xG per game |
Expected goals created over 90 minutes |
Base rate for goals scored in Poisson |
|
Opponent xG allowed per game |
Defensive record in xG terms |
Base rate for goals conceded in Poisson |
In short, xG is your measuring tape for chance quality, while Poisson is the calculator that converts that quality into goal-count probabilities you can compare with bookmaker odds.
Step 1: Building Attack and Defence Ratings from xG
To use xG inside a Poisson framework, you first turn raw xG numbers into attack and defence ratings for each team.
Simple workflow for xG-based team ratings
Below is a straightforward process you can follow using any public xG data (from league websites, analytics platforms, or data providers):
- Collect match-level xG for each team: xG for and xG against for every league match.
- Compute league averages: average xG scored and conceded per team per match for the whole league.
- Calculate team attack rating:
- Attack strength = (Team’s average xG for per game) ÷ (League average xG for per game).
- Attack strength = (Team’s average xG for per game) ÷ (League average xG for per game).
- Calculate team defence rating:
- Defence strength = (Team’s average xG against per game) ÷ (League average xG against per game).
- Values < 1 = strong defence (concedes fewer xG than league average).
- Defence strength = (Team’s average xG against per game) ÷ (League average xG against per game).
- Adjust for sample size: use at least 8–10 games; early-season data should be blended with last season or smoothed with league average.
- Update regularly: recalculate ratings every few matches as new xG data arrives.
The idea is that attack ratings > 1 show sides that create better chances than the competition, while defence ratings < 1 highlight teams that restrict shot quality. These relative strengths are what you will plug into the Poisson forecast for each fixture.
Step 2: Deriving Expected Goals for a Specific Match
Once you have ratings, you can convert them into expected goals for a given game, home and away.
Quick recipe for match-level xG forecasts
Use this template to get projected xG values before running the Poisson model:
- Start from league base rates:
- League average home xG per team per game (LH)
- League average home xG per team per game (LH)
League average away xG per team per game (LA)
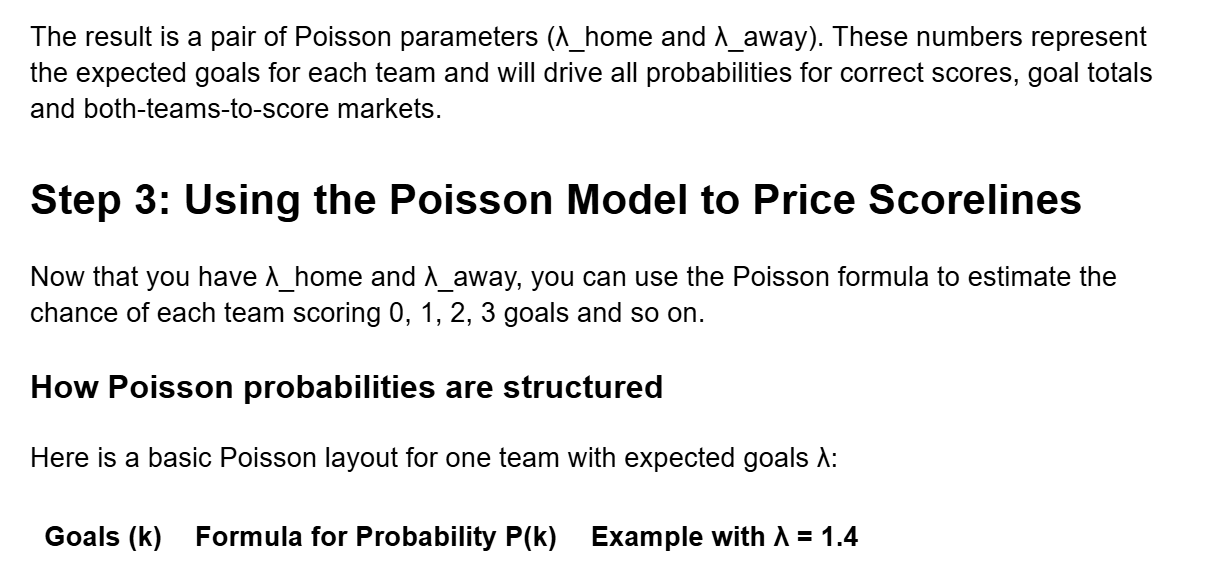
For a match, you assume the home and away goal counts are independent Poisson variables. Multiply the single-team probabilities to get the joint probability for any scoreline (e.g., P(Home 2–1 Away) = P_home(2) × P_away(1)). Summing all relevant scorelines gives you probabilities for:
- Home win, draw, away win (1X2).
- Over/under certain goal thresholds.
- Both teams to score (BTTS) yes/no.
Once you have those probabilities, you compare the implied odds (1 ÷ probability) with the bookmaker’s prices to see where the biggest gaps appear.
Step 4: Fast Practical Setup for Bettors
Many bettors want a quick, repeatable workflow they can apply before a round of matches without needing full-blown programming skills.
Minimal setup checklist for a Poisson + xG model
A compact checklist can help you get from raw data to actionable probabilities:
- Data source
- Choose a stable provider of match xG (paid or free).
- Export league data to a spreadsheet or a simple database.
- Choose a stable provider of match xG (paid or free).
- Spreadsheet structure
- One sheet for raw match data (teams, xG for, xG against, date, venue).
- One sheet for raw match data (teams, xG for, xG against, date, venue).
One sheet for calculated team ratings (attack/defence, home/away splits).
 5. Routine maintenance
5. Routine maintenance
- Update xG data after each matchday.
- Recalculate ratings and review whether model errors show systematic bias (for example, under-rating certain tactical styles).
This kind of setup can live completely offline in Excel, Google Sheets (used in offline mode) or similar. You can still follow live odds feeds on your bookmaker app while doing the modelling work in your own tool.
Step 5: Strengths, Weaknesses and Smart Use in Betting
No model is perfect. Poisson combined with xG is popular because it is transparent and easy to debug, not because it captures every nuance of football.
Pros and limitations of Poisson + xG
- Strengths
- Transparent assumptions and simple maths.
- Easy to implement in a spreadsheet or basic script.
- xG captures quality of chances better than raw shots or past goals.
- Useful for pre-match markets and season-long ratings.
- Transparent assumptions and simple maths.
- Limitations
- Assumes independence of goals and constant scoring rate across the match.
- Does not account for game state effects (parking the bus at 1–0, late pressure).
- Sensitive to bad xG models or skewed data (penalty-heavy matches, red cards).
- Needs enough data per team to avoid noisy ratings.
- Assumes independence of goals and constant scoring rate across the match.
The smart way to use this framework is as one layer in your decision process. Let the Poisson+xG model handle the heavy lifting for baseline probabilities, then apply qualitative judgement about injuries, tactical changes, fixture congestion, weather and motivation. If your numbers and your football knowledge point in the same direction – and the bookmaker price is still off – that’s where a bet starts to make sense.
Final Thoughts for Practical Bettors
Poisson and xG are not some mysterious tools reserved for quants at big syndicates. With a basic grasp of xG, a calculator or spreadsheet, and disciplined data collection, you can build a quick model that outputs fair odds for the most common football markets. From there, it becomes about routine: update your data, track how your probabilities perform over time, and avoid emotional chasing when the variance of football hits hard.
Used thoughtfully, a Poisson + xG setup helps you move from “I feel like both teams will score” to “My model says BTTS is 62%, the implied probability from odds is 55%; there is a margin here.” In a betting world full of hype and hot takes, having your own structured view of risk is one of the few real edges you can control.